get_effects() is a helper function to store effect estimates from
stm in a data frame.
get_effects(
  estimates,
  variable,
  type,
  ci = 0.95,
  moderator = NULL,
  modval = NULL,
  cov_val1 = NULL,
  cov_val2 = NULL
)
Arguments
- estimates
The object containing estimates calculated with
estimateEffect.- variable
The variable for which estimates should be extracted.
- type
The estimate type. Must be either
'pointestimate','continuous', or'difference'.- ci
The confidence interval for uncertainty estimates. Defaults to
0.95.- moderator
The moderator variable in case you want to include an interaction effect.
- modval
The value of the moderator variable for an interaction effect. See examples for combining data for multiple values.
- cov_val1
The first value of a covariate for type
'difference'.- cov_val2
The second value of a covariate for type
'difference'. The topic proportion of'cov_val2'will be subtracted from the proportion of'cov_val1'.
Value
Returns effect estimates in a tidy data frame.
Examples
library(stm)
library(dplyr)
library(ggplot2)
# store effects
prep <- estimateEffect(1:3 ~ treatment + pid_rep, gadarianFit, gadarian)
effects <- get_effects(estimates = prep,
variable = 'treatment',
type = 'pointestimate')
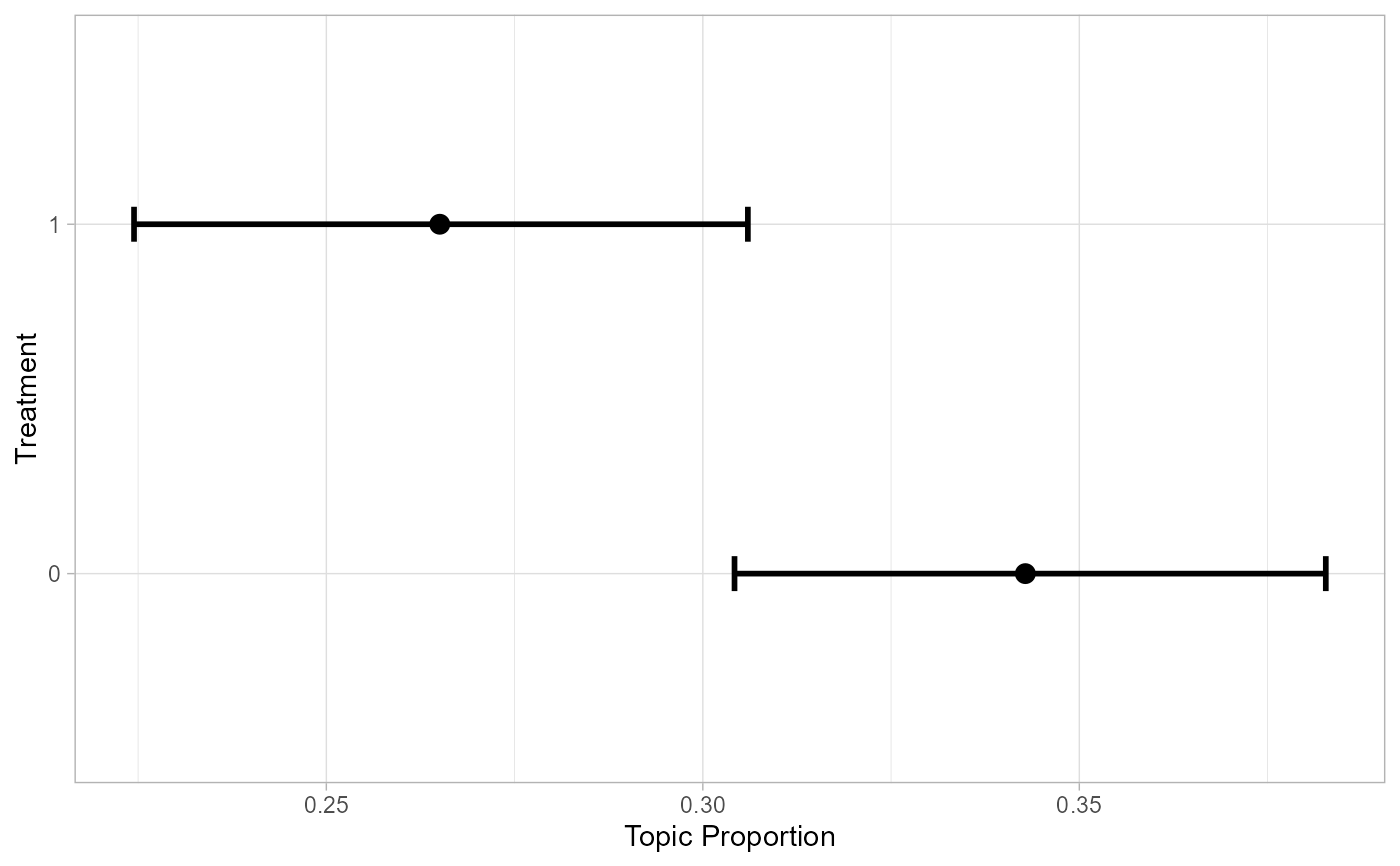
# plot effects
effects |> filter(topic == 3) |>
ggplot(aes(x = value, y = proportion)) +
geom_errorbar(aes(ymin = lower, ymax = upper), width = 0.1, size = 1) +
geom_point(size = 3) +
coord_flip() + theme_light() + labs(x = 'Treatment', y = 'Topic Proportion')
#> Warning: Using `size` aesthetic for lines was deprecated in ggplot2 3.4.0.
#> ℹ Please use `linewidth` instead.
 # combine estimates for interaction effects
prep_int <- estimateEffect(1:3 ~ treatment * s(pid_rep),
gadarianFit, gadarian)
effects_int <- get_effects(estimates = prep_int,
variable = 'pid_rep',
type = 'continuous',
moderator = 'treatment',
modval = 1) |>
bind_rows(
get_effects(estimates = prep_int,
variable = 'pid_rep',
type = 'continuous',
moderator = 'treatment',
modval = 0)
)
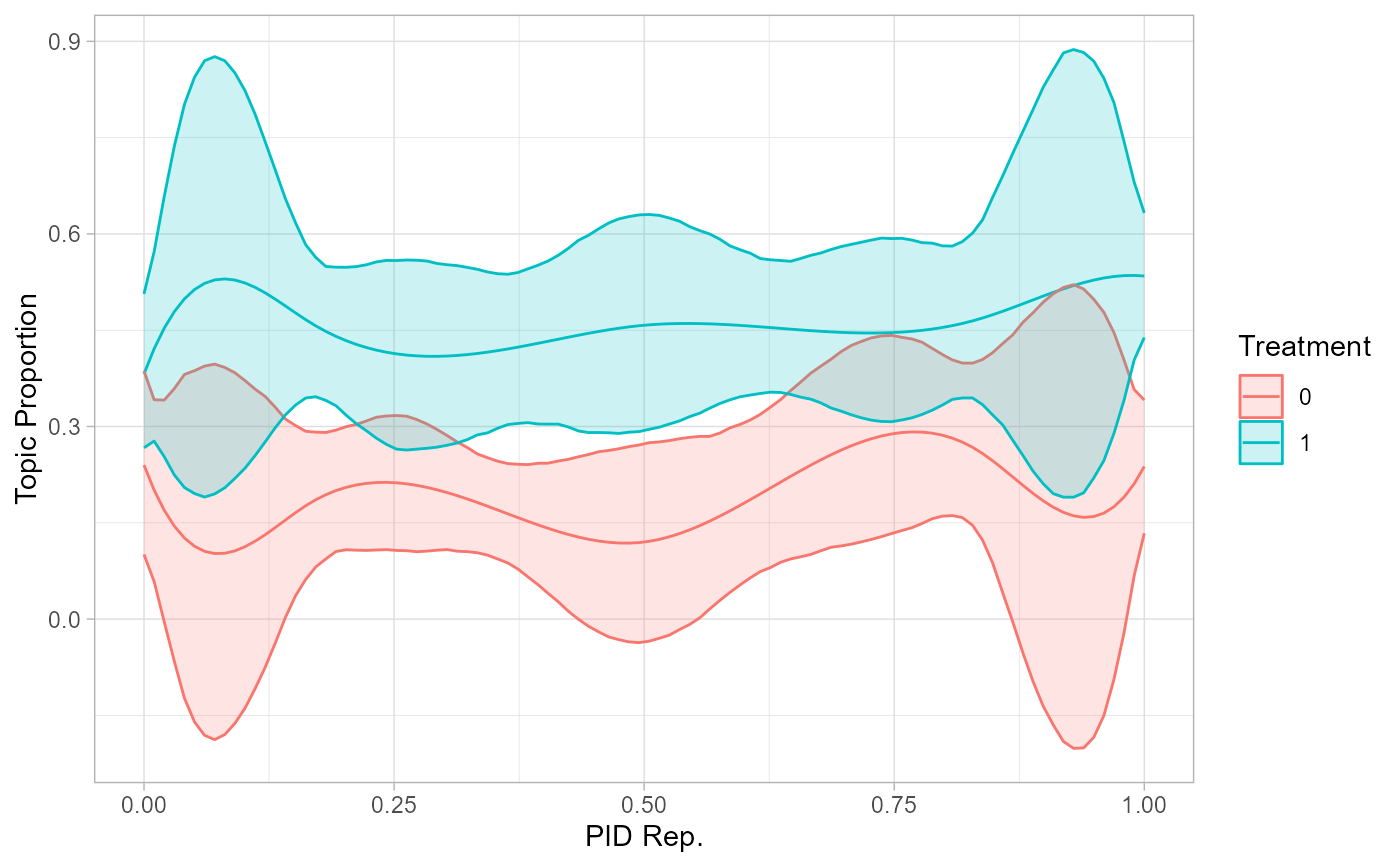
# plot interaction effects
effects_int |> filter(topic == 2) |>
mutate(moderator = as.factor(moderator)) |>
ggplot(aes(x = value, y = proportion, color = moderator,
group = moderator, fill = moderator)) +
geom_line() +
geom_ribbon(aes(ymin = lower, ymax = upper), alpha = 0.2) +
theme_light() + labs(x = 'PID Rep.', y = 'Topic Proportion',
color = 'Treatment', group = 'Treatment', fill = 'Treatment')
# combine estimates for interaction effects
prep_int <- estimateEffect(1:3 ~ treatment * s(pid_rep),
gadarianFit, gadarian)
effects_int <- get_effects(estimates = prep_int,
variable = 'pid_rep',
type = 'continuous',
moderator = 'treatment',
modval = 1) |>
bind_rows(
get_effects(estimates = prep_int,
variable = 'pid_rep',
type = 'continuous',
moderator = 'treatment',
modval = 0)
)
# plot interaction effects
effects_int |> filter(topic == 2) |>
mutate(moderator = as.factor(moderator)) |>
ggplot(aes(x = value, y = proportion, color = moderator,
group = moderator, fill = moderator)) +
geom_line() +
geom_ribbon(aes(ymin = lower, ymax = upper), alpha = 0.2) +
theme_light() + labs(x = 'PID Rep.', y = 'Topic Proportion',
color = 'Treatment', group = 'Treatment', fill = 'Treatment')